|
Maximum
control
and
flexibility
with E2E
software
 |
Adjust and
monitor all Super Sorter II
settings and information |
|
|
Send any
sorter information you want to
other locations via the internet |
|
|
Produce
graphs and charts showing any
performance information and
comparison |
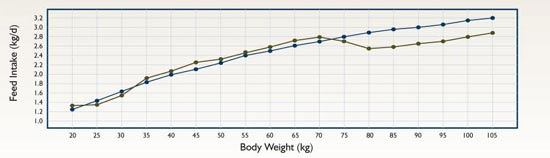
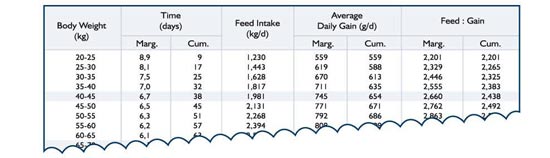
Print reports to show actual performance in
relation to a target performance.
Knowing daily feed intake, daily rate of
gain, temperature uniformity and water
consumption creates opportunities to improve
pig performance and profit
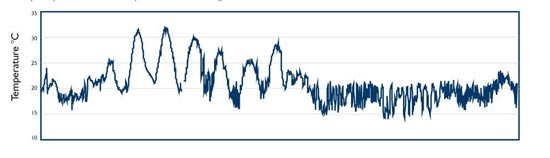
Print graphs . showing
performances like temperature, water and
feed consumption and temperature uniformity.
Show relation or comparison between any
performance values you want to see. The
temperature graph shown below
indicates swings in temperature. This
may not be due to ambient temperature but
perhaps the control stability or the control
settings.
BACK
NEXT |